Search another article?
Troubleshooting on Collector 6
In this guide, we show you how to perform debugging: to quickly check if the collector has all the main processes active for correct communication with the Host or SGBox appliance.
Docker and containers
Collector 6 introduces the use of docker and containers, to activate them correctly, it is necessary do port forwarding on the firewall. For more details, see: SGBox and Collector network requirements
after opening the Internet connection to our public registry address. You can debug using the CLI tool: to verify that the collector has correctly activated all key containers.
Connect to the Collector appliance via SSH (using Putty,Terminal or console), specifying the user CLI and the password you saved for it.
Go under System > Process Handling > Services status > SGBox Containers
Check if there are 4 active containers. See the image below for an example showing active containers.
Containers are Active: this means that your Collector is ready to be used.
Containers are not Active: this means that something went wrong during network configuration or port opening. We suggest following the Network debugging guide.
Network debugging
You can perform network debugging using the CLI tool.
Connect to the Collector appliance via SSH (using Putty,Terminal or console), specifying the user CLI and the password you saved for it.
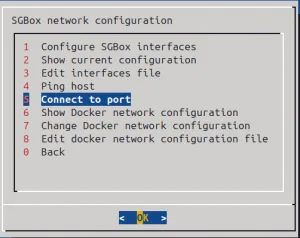
Go under Network Configuration > Connect to port
For example, let’s check if Collector reaches our registry. You can specify IPv4 or FQDN and Port.
The result may be Server is Responding or Cannot connect to the server.
If the result is Cannot connect to the server, we recommend checking that the firewall managing the network is not blocking communication. For more details, see: SGBox and Collector network requirements or provide the results obtained from debugging to SGBox Support for further assistance.
Dump network traffic
You can use the CLI tool to check if there are any problems with receiving data from the Hosts.
Connect to the Collector appliance via SSH (using Putty,Terminal or console), specifying the user CLI and the password you saved for it.
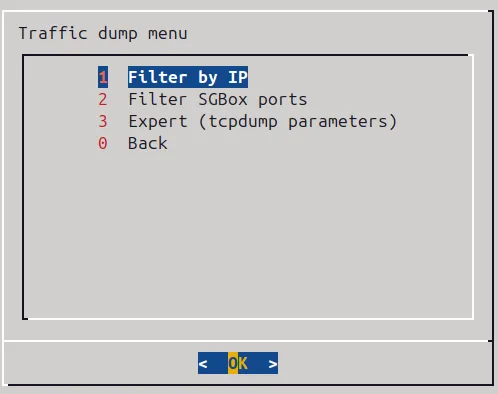
Go under Stats > Dump network traffic
- Filter by IP: simple filter on data source IP all ports and protocols
- Filter SGBox ports: simple filter on ports 514 and 443 from all the data source
- Expert: you can enter all the tcpdump parameters.
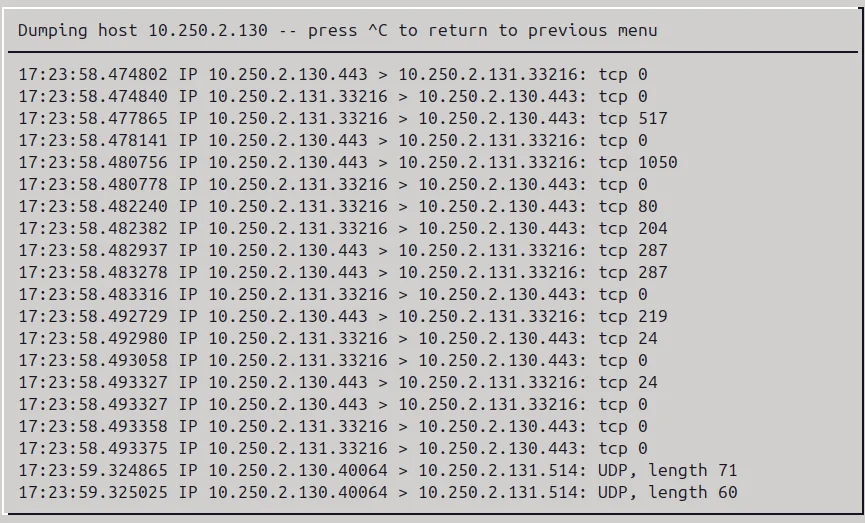
For example, let’s use the Filter by IP option to check if the collector receives the log from the Host.

If the host sends logs to the collector, then you should see traffic passing through, as in the example above.
If you do not see any traffic passing through, double-check that you have correctly configured the source to send logs, or check that there are no firewall blocks between the source and the collector.


