Search another article?
Introduction
ADE is a tool designed to constantly monitor your Active Directories status, determine the relative risk and warn when KPI thresholds are exceeded.
It is also capable to generate lists that can be used by other SGBox modules to achieve specific tasks such as event correlation, filtered reports, etc. The module generates some “system” lists by default as well as custom lists (1). This first release will enable only the basic function described above, but there is much more on the module roadmap: Group membership comparison between current values and historical snapshots, state and compliance reports, file system permission and many other. The module is deeply integrated with other SGBox modules and give the maximum visibility if used together with the Windows Audit and Windows File System Audit SGBox packages.
(1) Currently predefined lists are:
- Domain Administrators lists
- A Domain Administrator list for each AD Domain
- A list containing the Administrators of all the defined AD Domains
- A inactive Domain Administrator list for each AD Domain
- A list containing inactive Administrators of all defined domains
- Disabled Users lists
- A disabled User list for each AD Domain
- A list containing the disabled Users of all the defined AD Domains
- A inactive User list for each AD Domain
- A list containing the inactive Users of all the defined AD Domains
Requirements
The ADE module to communicate with Active Directory uses standard Microsoft protocols. Based on your LDAP service, you need to enable the port 389 (LDAP) or 636 (LDAPS), so you must have these ports open before configuring the module. To date, the ADE is not a multitenant module and can only collect data via a direct connection.
How to: First time configuration
When you access the module for the first time, the system initializes the environment and guides you to the configuration panel providing all the information needed for the “first time configuration”. There are 3 sections in the configuration panel, however for the 1st time configuration you can keep the defaults for the Common Parameters and the Alert Parameters sections and work on the Domain(s) Parameter ones.
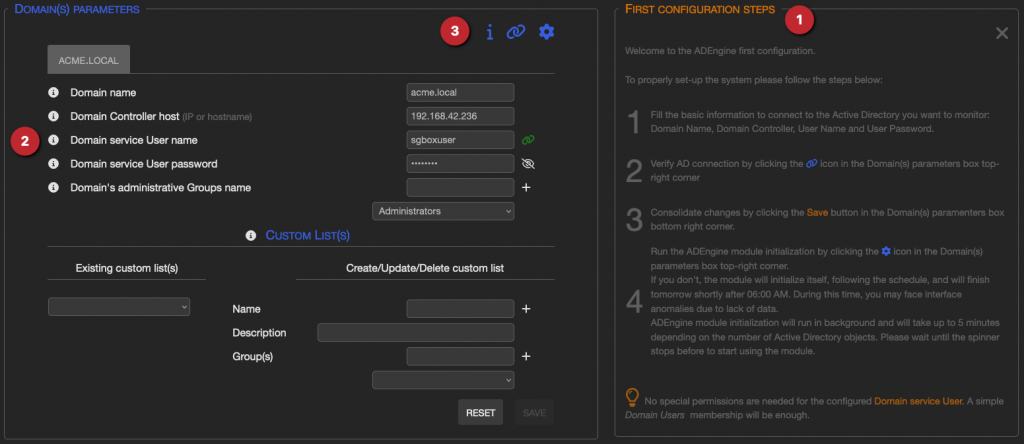
You should start by configuring the first Active Directory domain you want to monitor, so please follow the instructions in the First Configuration Steps box (1).
It will be possible to add additional domains, by reloading the configuration page, after completing the 1st configuration steps.
Please note that no special permissions are needed for the service user you are defining here, a simple Domain Users membership will be enough.
Clicking on any of the info bullet (2) will show specific parameter information. You can click the i to get back to the First Configuration Steps list (3).
By clicking the blue chain icon, as described in step 2, the system will try to bind the AD with the supplied credentials and a little green chain will be show aside the user name, if the bind was successful. Otherwise a red chain will be shown.
How to: Configuration
As told above there are 3 configuration sections:
Common Parameters
In the “Common Parameters” section you can customize general options for the ADE module.
By clicking on any of the info bullet (1) you’ll get detailed information about the selected parameter (2)

Domain(s) Parameters
Domain(s) Parameter section is composed by two sub-sections, the first is related to the AD domains to be monitored while the second allows to configure custom lists.
Domain(s) configuration
As for the “Common Parameters”, by clicking on any info bullet you’ll get detailed information about the selected parameter and, compared to the first configuration, you can see that it is possible to perform different actions (1).

- Clicking the chain icon will verify supplied credentials binding the specified AD Domain.
- Clicking the gear icon will run an on-demand information collection for all the configured AD domains and consequently refresh the extracted list with the updated information. This can be useful if you don’t want to wait for the hourly automated run to update AD information after an AD change.
- Clicking the plus icon will add a new empty AD domain configuration tab.
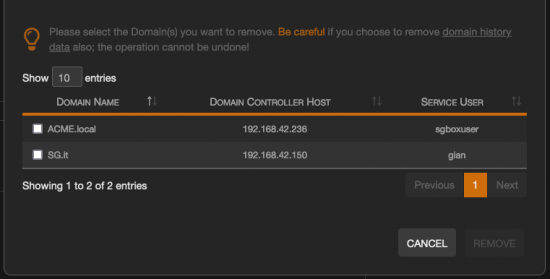
- Clicking the trash icon will let you to choose which domain to remove from monitoring.
Custom List(s) configuration
Custom List(s) allows you to create custom lists containing users recursively belonging to the specified group(s).
These list(s) can be useful in the Correlation module (LCE) or in the “Query” section, to spot specific events related to the users belonging to certain groups.
A detailed explanation on how to configure this option will be shown by clicking the info bullet (1).
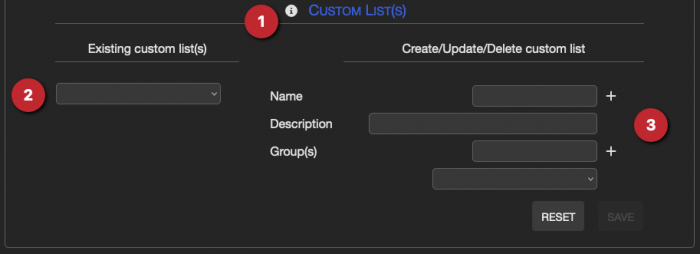
Existing custom lists, if any, will be shown in the box on the left side (2) and new list can be created by filling the fields on the right (3).
Alert Parameters
In the “Alert Parameters” section you can customize some KPI settings and define the default e-mail recipients to which alert messages will be sent once a day.
As for all other parameters, by clicking on any of the info bullet you’ll get detailed information about the selected parameter.

Restore previous configuration
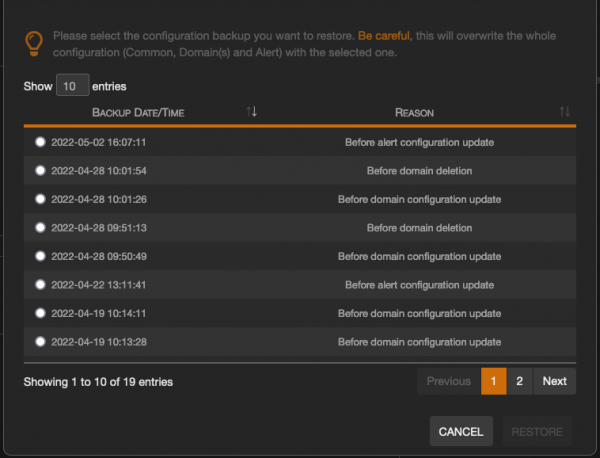
The system will take automatic configuration backups, each time a change is made, before to update the configuration itself. It is possible to restore previous configuration by clicking on the blue Safe icon.

A new panel will be displayed from which to choose the backup version to be restored.
How to: Dashboard
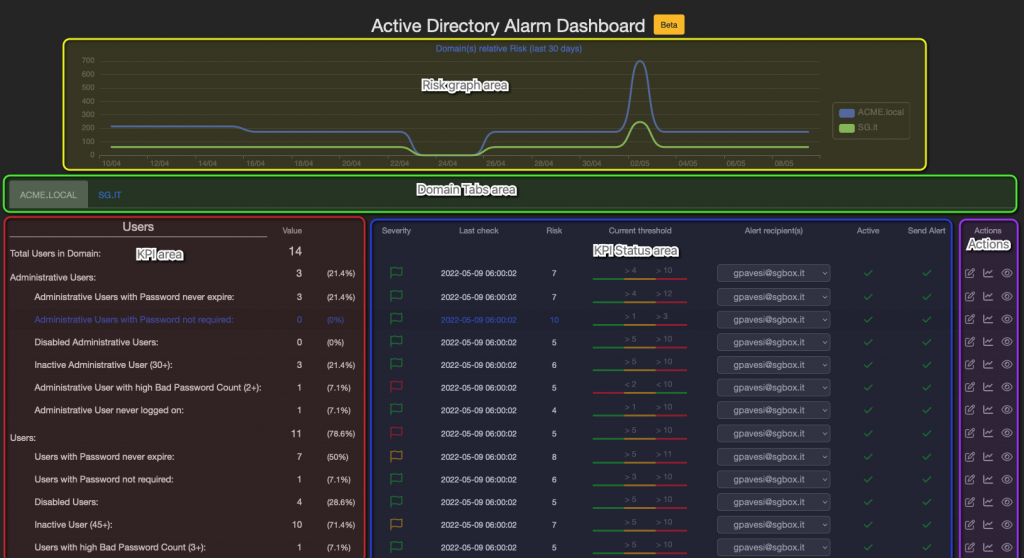
Risk graph area
This area contains the Relative Risk graph for the defined domains. Assuming that if all the KPIs do not exceed the defined thresholds the overall risk is 0 (zero), the system calculates the relative risk level, KPI by KPI, by multiplying the risk associated with each KPI by the delta between the observed value and the defined threshold.
For example, if the risk associated to a KPI is 7, the observed value is 25 and the defined thresholds are 20 for the low threshold and 30 for the high one, the delta will be 25 – 20, so the daily risk for this KPI will be (25-20) * 7 = 35.
Then single KPI risk are summed together to give the daily risk level for that specific AD domain.
This is useful when, once you have identified your own domain baseline by opportunely trigger KPIs thresholds, to graphically spot issues. You’ll receive a daily alert e-mail about the exceeded thresholds also.
Domain Tabs area
This area contains one tab for each defined domain, clicking on a domain tab will switch to the domain specific dashboard from which you can configure domain KPIs.
KPI area
Here are shown all the KPIs with their most recent value
KPI Status area
In the KPI status area you can see the result of the analisys for each KPI:
- Severity column graphically shows which KPI threshold has been exceeded.
- Last check column contains the date time of the last analysis run.
- Risk column contains the KPI related Risk.
- Current threshold column graphically shows the KPI defined threshold value.
- Alert recipients column shows the recipient list where KPI alerts will eventually be sent.
- Active column shows if the KPI will or will not be analyzed.
- Send Alert column shows if KPI alerts will or will not be sent.
Action area
Action area contains the buttons to interact with the KPI configuration settings.
By clicking the pencil icon, the edit panel will be shown allowing the KPI settings customization, you can then set your specific KPI threshold as well as set the KPI risk level or add one or more specific recipients for the KPI. Finally you can choose to activate or deactivate the KPI check and to enable or disable KPI email notification.

To get some help in the threshold definition, you can click on the graph icon to open a KPI statistic panel.

And finally, by clicking on the eye icon you can have the details about the Users, Groups and Computers that are related to the KPI.

Please note that all these last three panels can be opened together to have a complete KPI picture.
Add-on Packages
A specific ADEngine Package is available in the SGBox Package section SCM->Application->Packages.
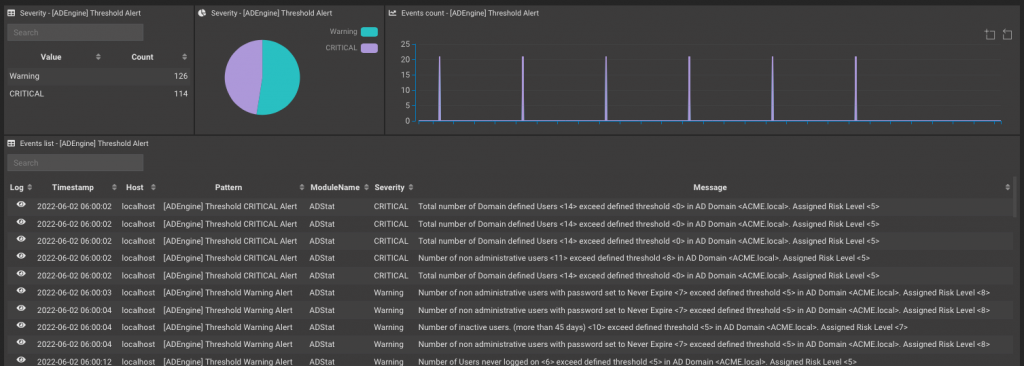
Installing the package will provide patterns and a couple of dashboards to keep under control the ADEngine module.
ADEngine Self Audit dashboard
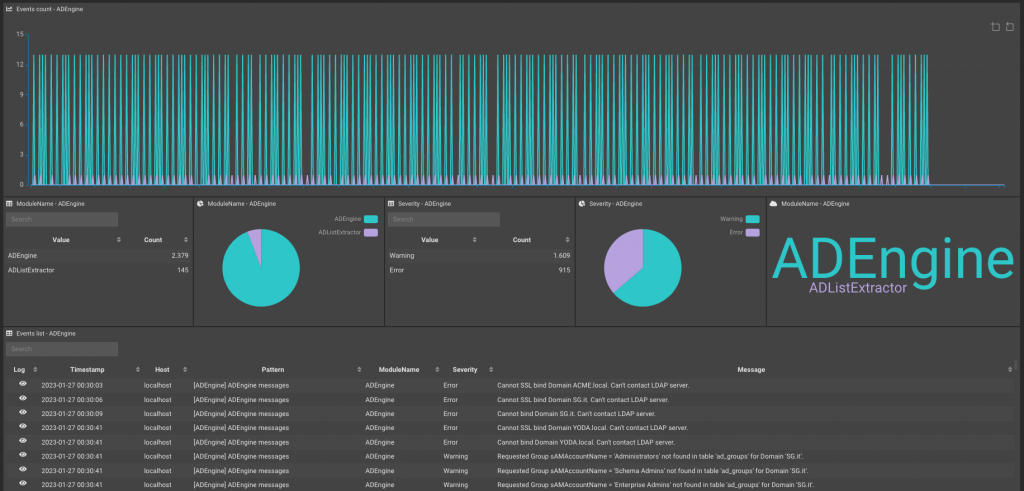
ADEngine Alerts dashboard
