Proteggiamo il tuo ambiente digitale da qualsiasi attacco informatico. Sfrutta tutte le potenzialità della piattaforma SGBox!

Gallery

Contatti

Via Melchiorre Gioia, 168 - 20125 Milano

info@sgbox.it

+39 02 60830172

Search another article?

You are here:
< Back

The Class/Pattern Analysis panel allows you to perform a specific analysis on classes and hosts.

Main Page
Class/Pattern Analysis

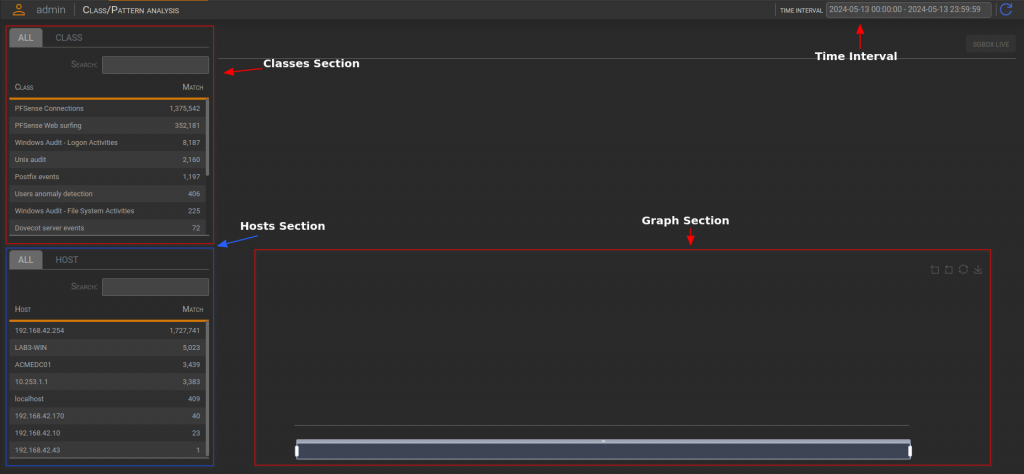
This page serves the purpose of displaying in various significant ways. Firstly, at the top of the page, you can select a Time interval to load hosts and classes based on a specific time period. You can conduct your searches using the Classes section and the Host section to filter the different events.

First Analysis

Class/Pattern Analysis

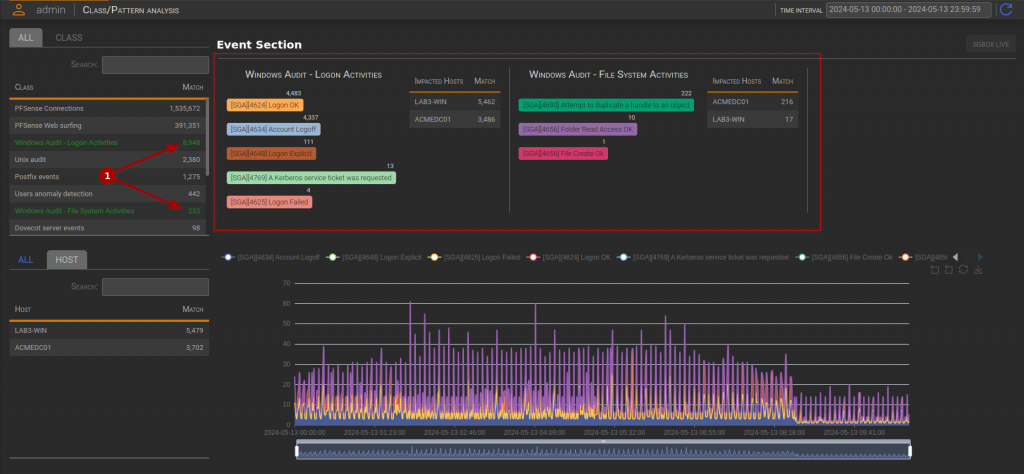
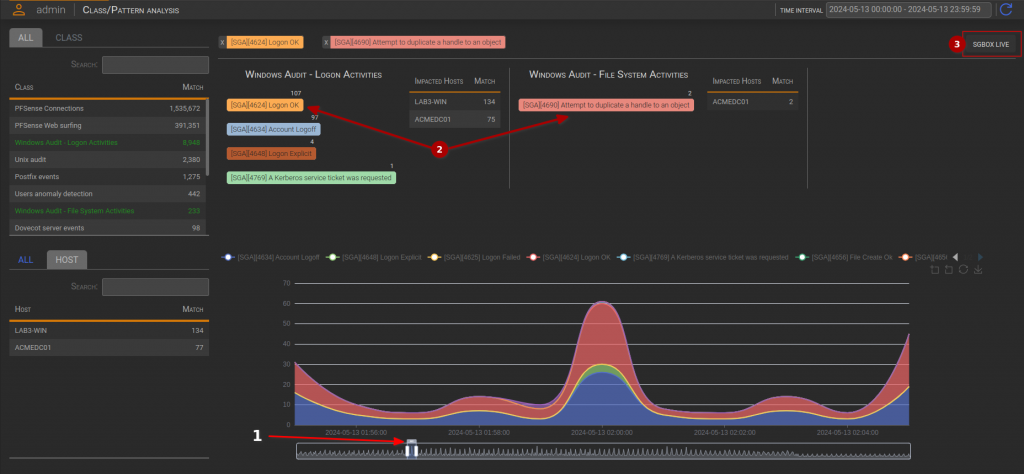
First, you have to select one or more classes/hosts, in this case I chose two classes. The system will then load the Event Section, and the Hosts Section will be updated, along with the graph.
The Event Section displays all the involved patterns and hosts (impacted hosts). At this point, the user can specify a time interval by zooming in on the graph. To complete the configuration the user needs to select up to five patterns for analysis.

The following image represents a complete configuration:
Class/Pattern Analysis

I’ve chosen a time period using the graph (1), data has been loaded. After selecting the two patterns (2), The SGBox Live Button has been enabled. Everything is ready to start an SGBox Live analysis.

SGBox Live

Class/Pattern Analysis

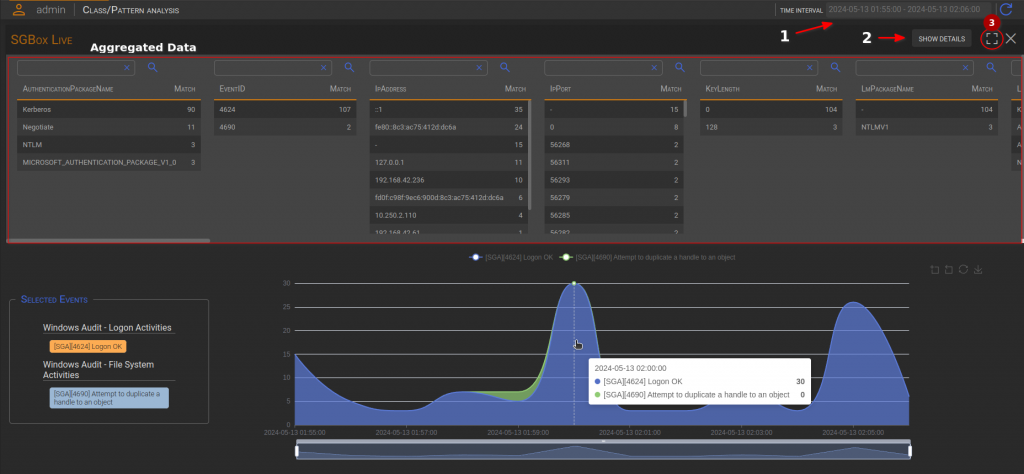
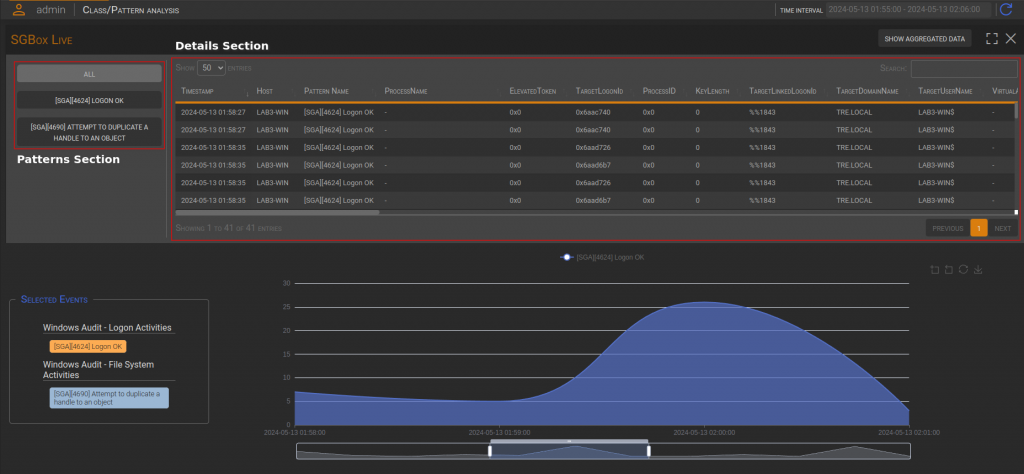
The Time Interval (1) and the Graph have been updated based on previously selected time period. The Show Detail Button (2) replaces the Aggregated Data view with the Details view to provide more in-depth information about the events.

The icon (3) adjusts the height and overlays the graph.

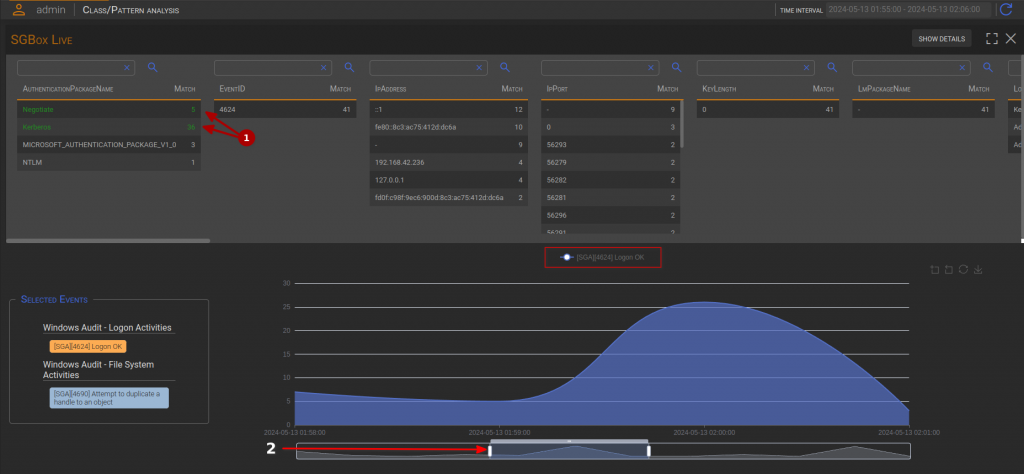
The Aggregated Data view consist of parameters tables ordered by count. Parameters can be used to further data filtering, and the graph provides information about match per minute. The remains dynamic, allowing the user to resize the time interval as often as desidered.
Class/Pattern Analysis

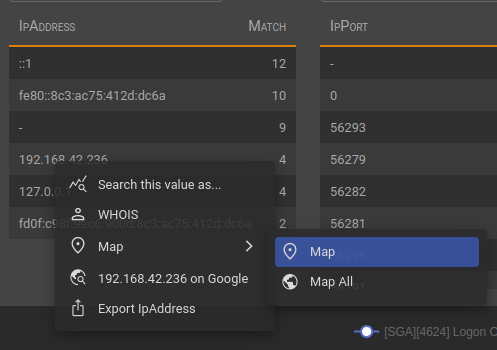
As you can see, after selecting parameters (1) and choosing the time period (2), data has been reloaded. The Aggregated data view now displays the matches that occurred during that time. If the user wants more information about specific value parameters, they can right-click and perform various actions.
Class/Pattern Analysis

Search this value as…

Class/Pattern Analysis

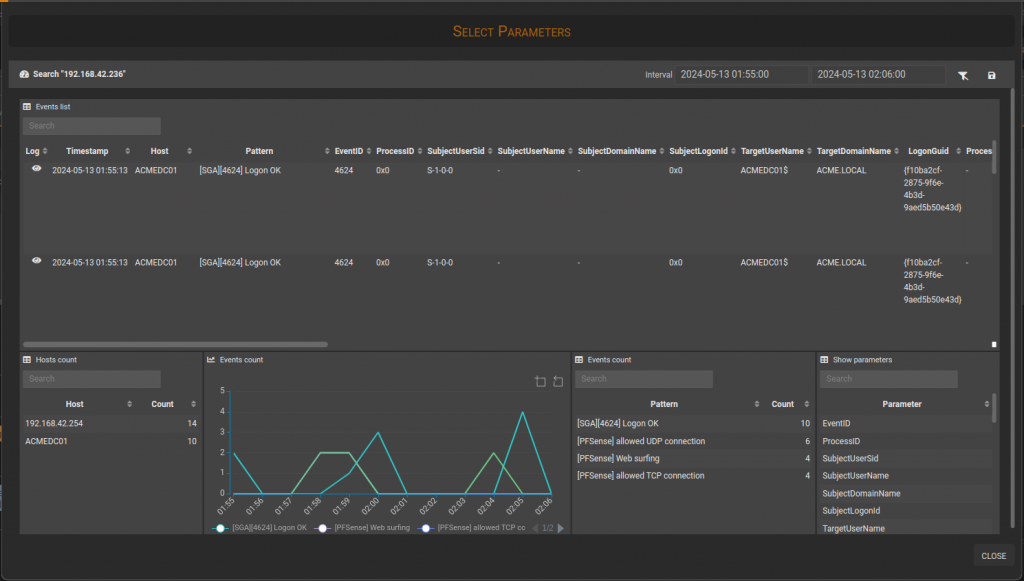
SEARCH THIS VALUE AS… After selecting the desidered parameters, SGBox will generate a dashboard that searches for the value taken into account for all the selected patterns. The user will receive a view similar to this.

Class/Pattern Analysis

WHOIS

Class/Pattern Analysis

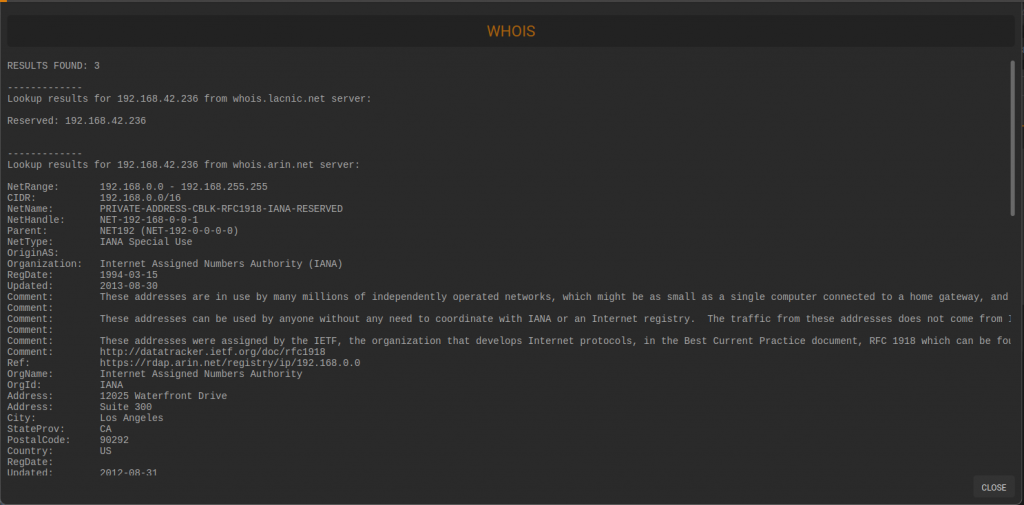
WHOIS is a query and response protocol that is used for querying databases that store an internet resource’s registered users or assignees. These resources include domain names, IP Address blocks and autonomous system.

Map

Class/Pattern Analysis

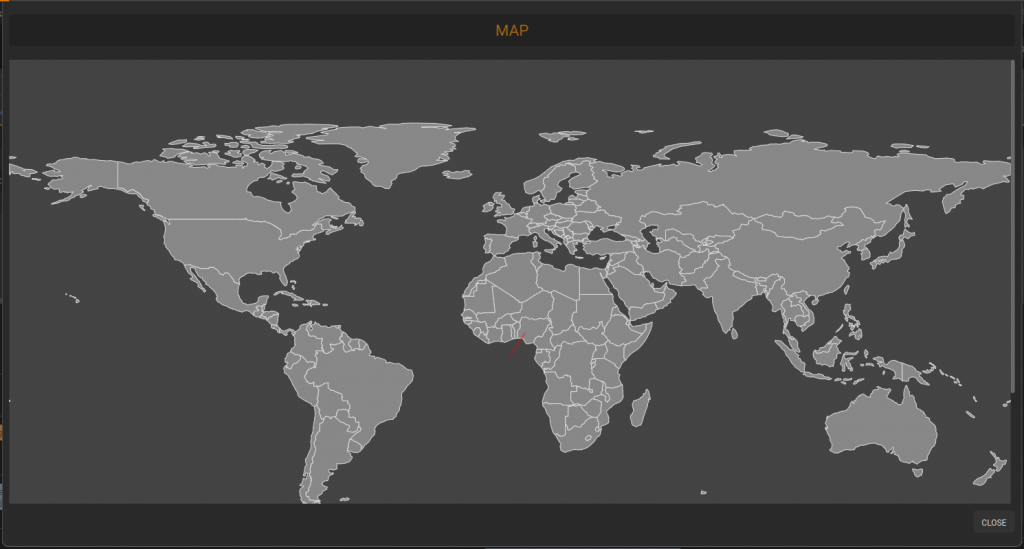
MAP locates one or more hosts on a world map.

Parameter Value on Google

SGBox redirects you to a Google page where a query has been performed using the specified parameter value.

Export Parameter Table

SGBox saves the table as CSV file containing parameter values, their translations and their matches.

Details view
Class/Pattern Analysis

The Details view offers a comprehensive overview of the logs. Logs can be displayed together or split by patterns. Patters Section is used to filter the information. In this view, you can also zoom in on the graph to inspect a particular time period.