



Search another article?
Purpose of the Dashboard
In SGBox, key elements and the most important monitoring data are displayed to the administrator immediately after logging in through the Dashboards.
The dashboards are designed to provide an immediate overview of the security status and performance of the IT/ICT infrastructure. They can be customized so that each administrator or user views only the real-time information, charts, and widgets that are strictly relevant to their activities.
Please note: while this guide explains how to manage dashboards from scratch, keep in mind that the packages installed for integrated devices in SGBox already contain default dashboards. SGBox users can use these to view results from various classes/events without having to build them from the ground up. The purpose of this guide is to walk users through how to create, delete, or modify dashboards and widgets based on their specific needs.
Create a dashboard
To create a new dashboard, log in to the SGBox web interface.
Go to SGBox > SCM > Dashboard and click on + Create a new dashboard. After clicking this button, a new dashboard named Dashboard (followed by a random number) will appear in the dashboard list.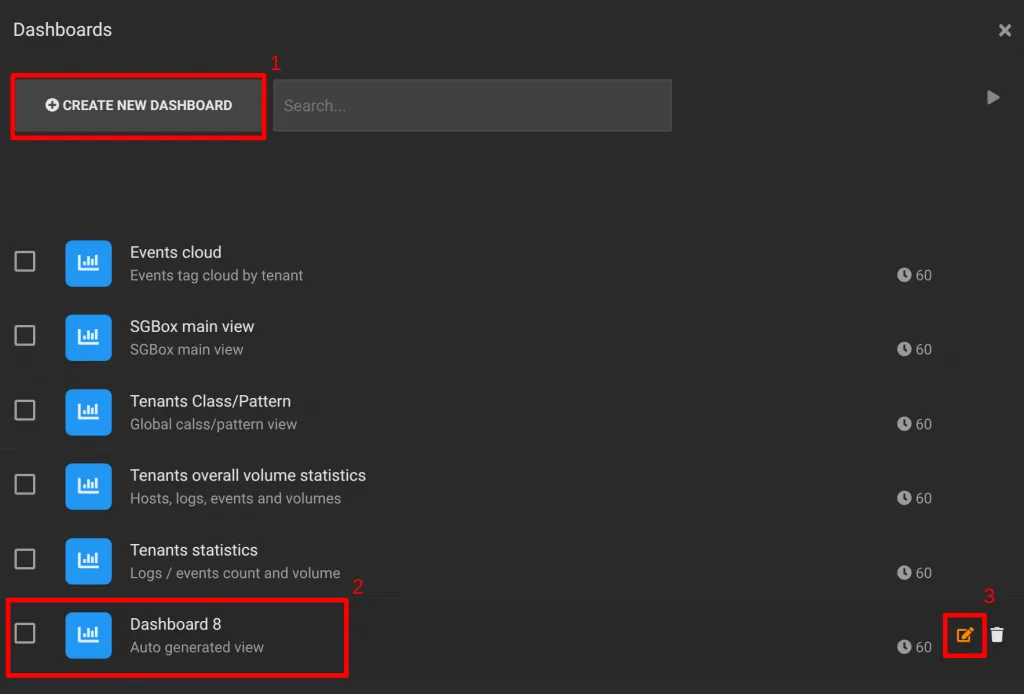
To rename the dashboard, click the Edit icon 🖍️ (3) and assign an appropriate name based on the events you want to display.
In the example below, we will name the dashboard PfSense VPN Logon Activities, as we will use the WIDGET option inside the dashboard to display the PfSense VPN Logon Activities events currently being analyzed by SGBox.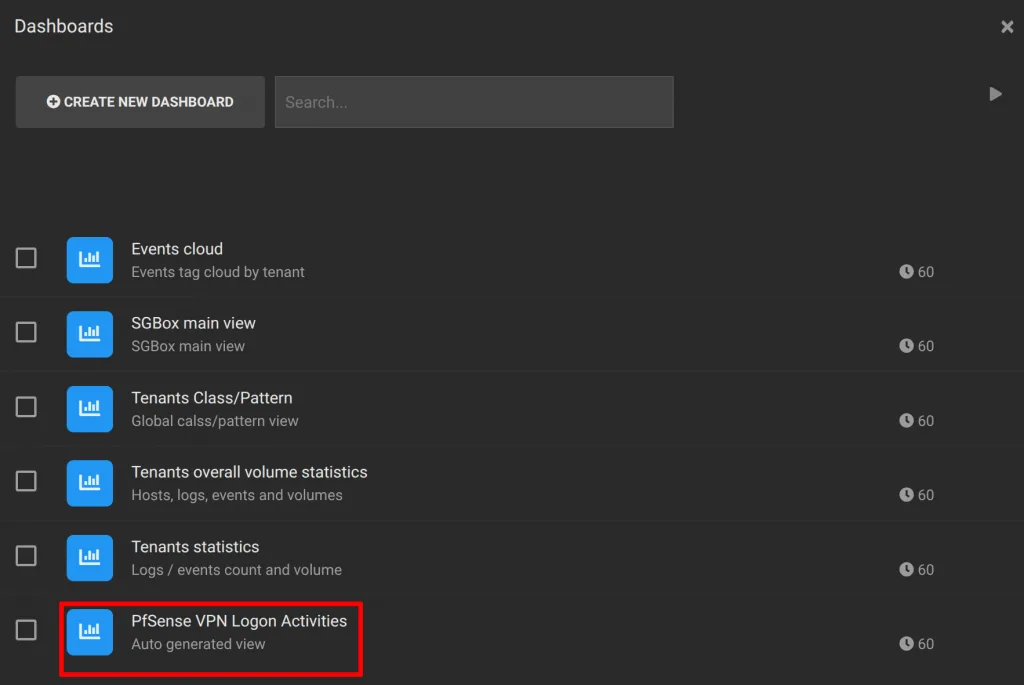
Manage new Dashboards
Once you have created the new dashboard, you need to click on its name to open it.
For example, PfSense VPN Logon Activities. The dashboard right now is empty, but you can compose it with numerous widgets.
Widgets are located inside the dashboard and are divided by the different modules that make up SGBox. These widgets are designed to display key information easily and intuitively. Let’s see how to do it.
Once you have created and opened a dashboard, such as PfSense VPN Logon Activities, you will see that it contains no widgets yet.
- To add a widget, click on + WIDGET.
- Then, select your desired widget.
Please note that there are many widgets available, and they are categorized by module. This guide focuses on how to use one of the most important and frequently used widgets, which can be found under WIDGETS > LM > Pattern analysis.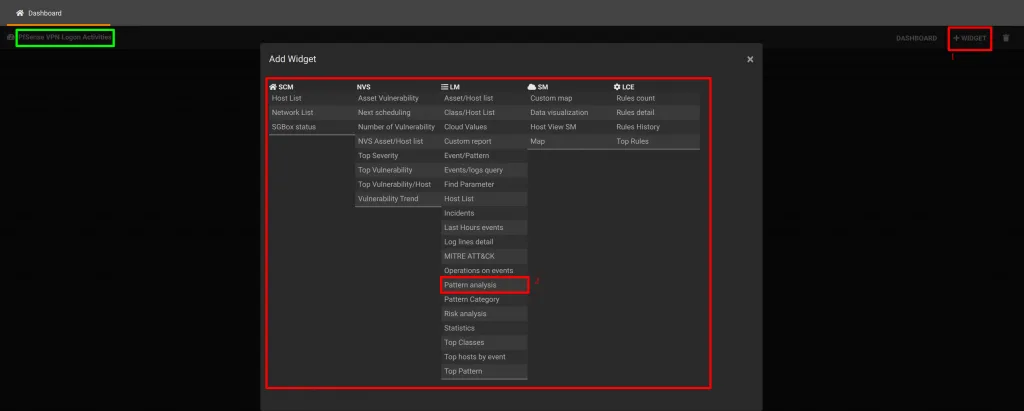 Once the Pattern analysis widget is selected, the user can choose which options to configure. The available fields are:
- Host – allows you to select one or more sources from the host list.
- Classes – allows you to select one or more event analysis classes.
- Patterns – allows you to select one or more patterns from the selected classes.
- Widget to show Class – contains sub-options such as:
- Classes count – displays the Top 10 classes.
- Events count – displays the Top 10 events.
- Hosts count – displays the Top 10 hosts.
- Events detail Widget – displays the Top 100 results of the selected events (Patterns).
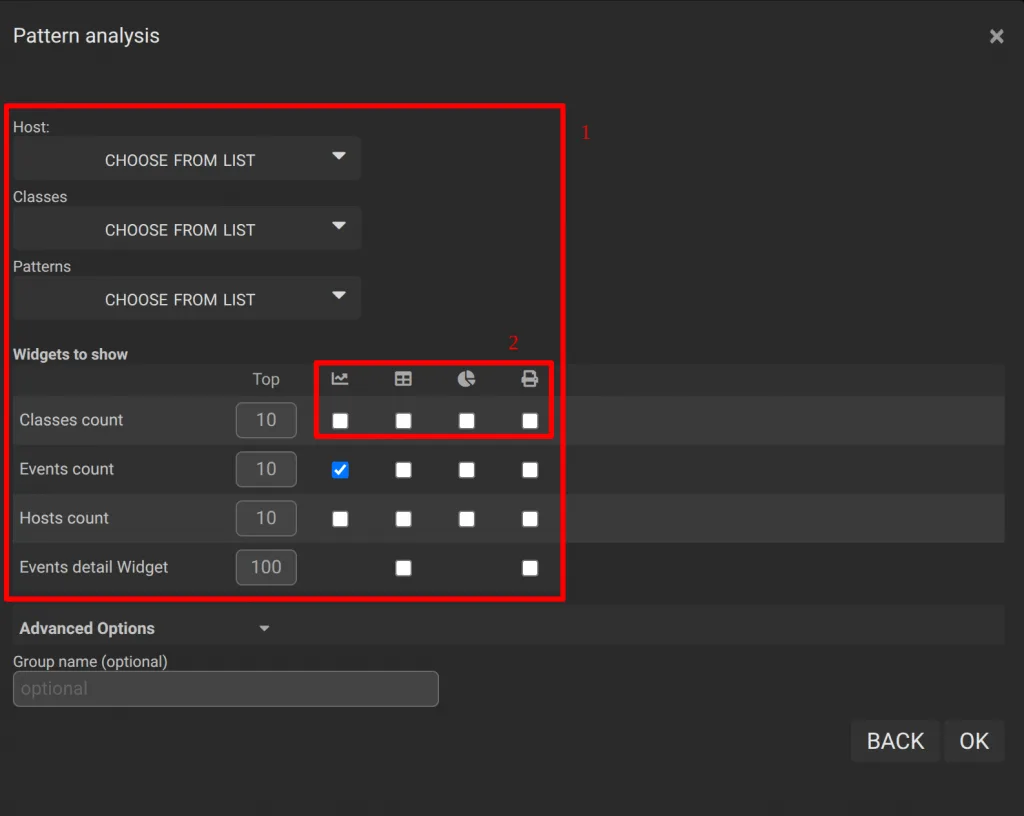 Note: In the Widgets to show section, the Admin user can choose the type of chart to display the widget’s details. For example, under Events detail Widget, the Hosts count values can be displayed as a table chart. This is optional, and it is up to the user to choose their preferred chart type.
Once the Pattern analysis widget is configured inside the dashboard, save the changes by scrolling down the widget until you find the OK / Save button. After clicking save, the user will be able to see the results on the dashboard based on the selected fields and chart types.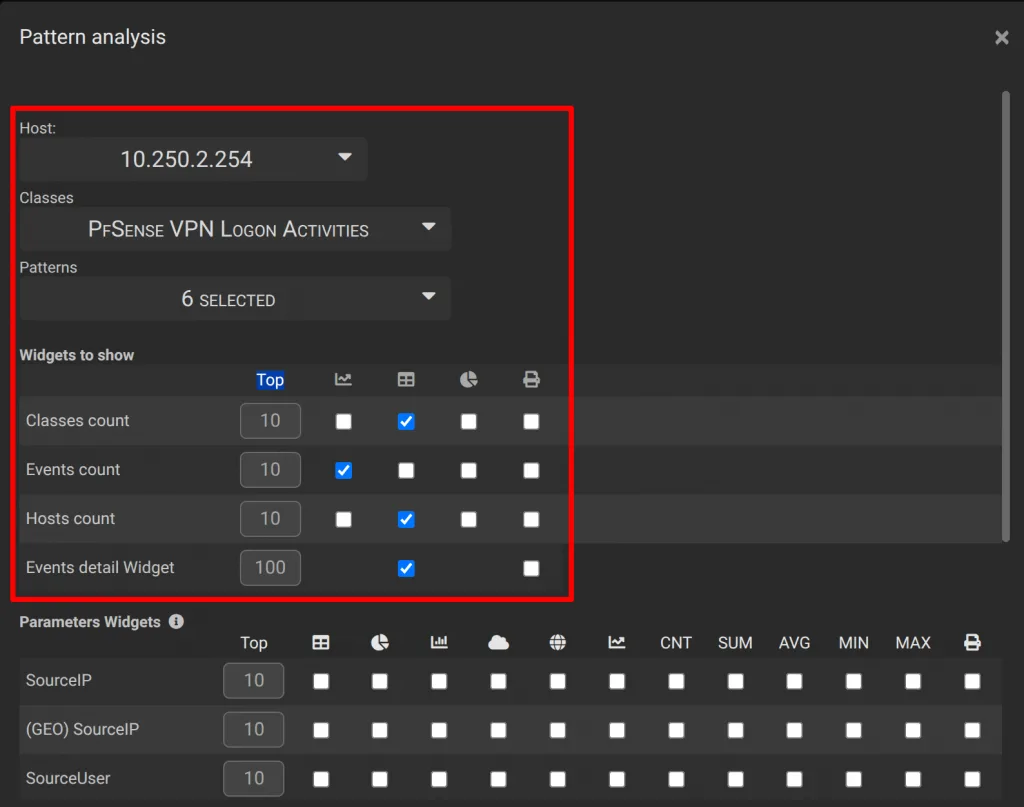
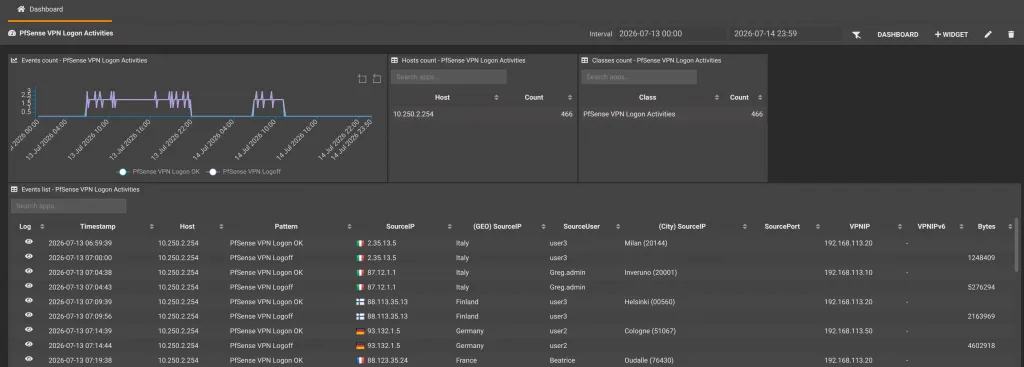 Note: You can drag and drop or resize widgets within the dashboard using your mouse cursor to customize and improve the layout of the displayed results.
Edit Widgets
You can edit individual widgets or groups of widgets to modify the number of top results displayed, or to add new parameter-based widgets extracted from the patterns shown on the dashboard.
Edit Individual Widget (Basic)
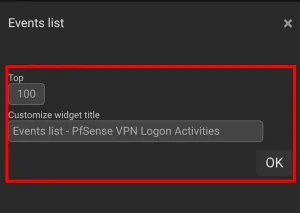
From the dashboard, an administrator can select a widget to display an Edit (🖍️) icon. Clicking this icon allows you to modify ONLY values such as Top and Customize widget title (widget name). Save your changes by clicking OK (SAVE).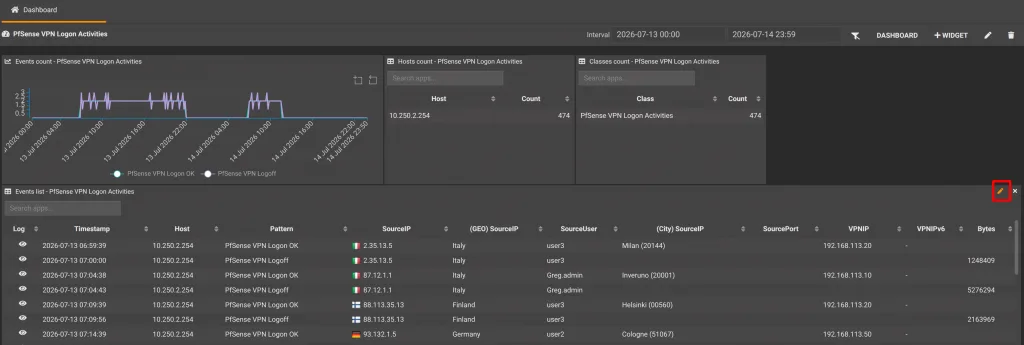
Edit Widget Group (Advanced)
From the dashboard, an administrator can select the Edit Widget Group (🖍️) icon.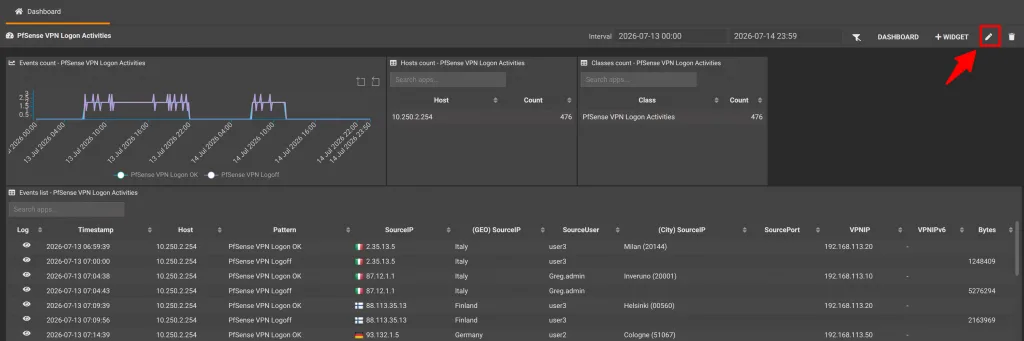 Through the popup window, you can configure default items (such as Widget to show Class) or individual selected pattern parameters. For each item, you can:
- Select the type of chart you want to use to display the results.
- Modify the TOP N value.
- Remove a specific chart option so it no longer appears on the dashboard.
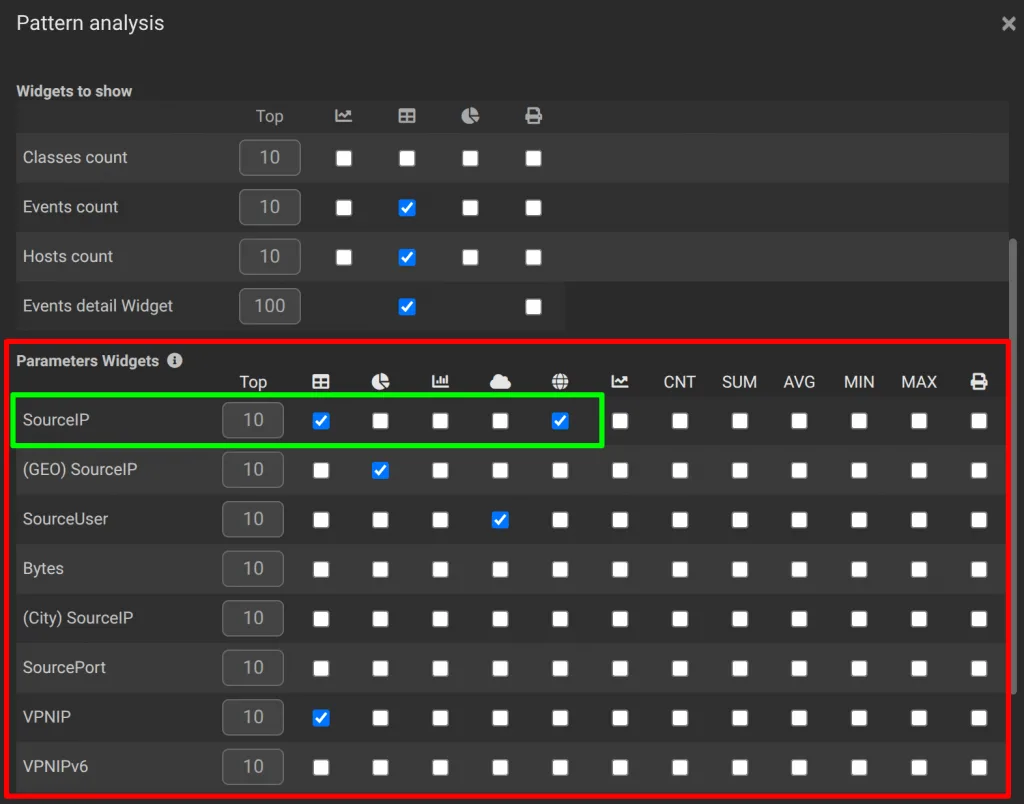 Once you have configured your preferences and chosen the desired charts for each parameter, save the changes by clicking OK (SAVE). This will generate new widgets on the dashboard based on your settings.
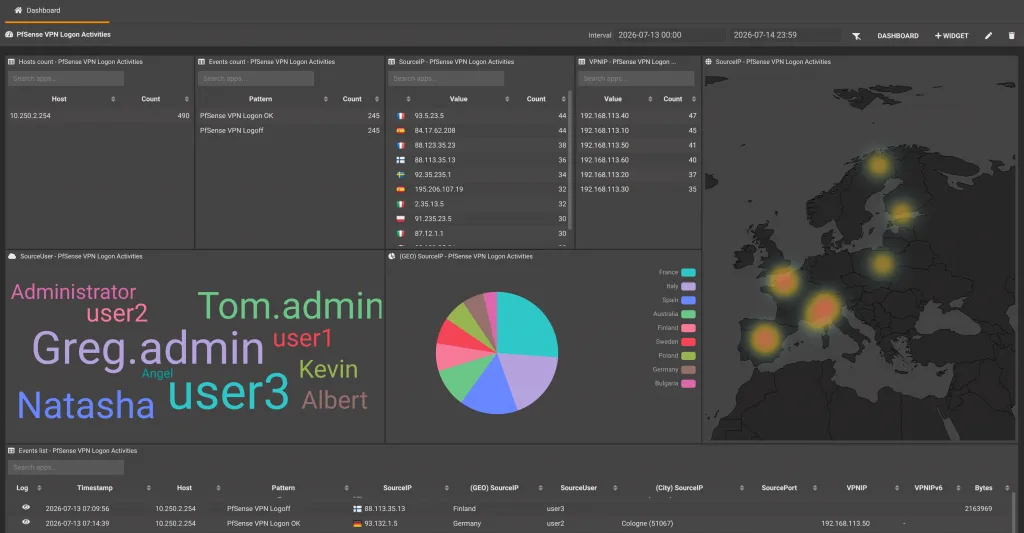 Once these widgets are displayed, you can freely drag and drop them to arrange the layout and charts according to your needs.
Delete Dashboard
To delete a dashboard, navigate to SGBox > SCM > Dashboard.
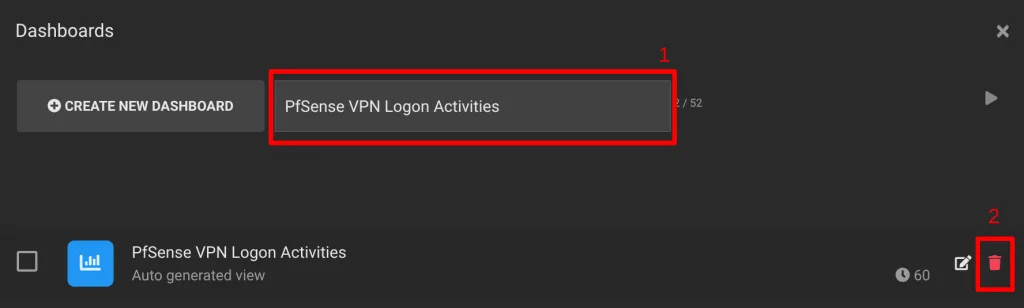
- Click on the Dashboard menu in the center of the page and select the dashboard you want to delete.
- Click the Recycle Bin icon 🗑️ on the dashboard you want to delete.
- Confirm the operation by clicking the OK button.